
Metrics and reports
Lorem ipsum dolor sit amet consectetur. Consequat aliquam tortor malesuada habitasse quis. Commodo a ipsum placerat quam consequat quisque nec.
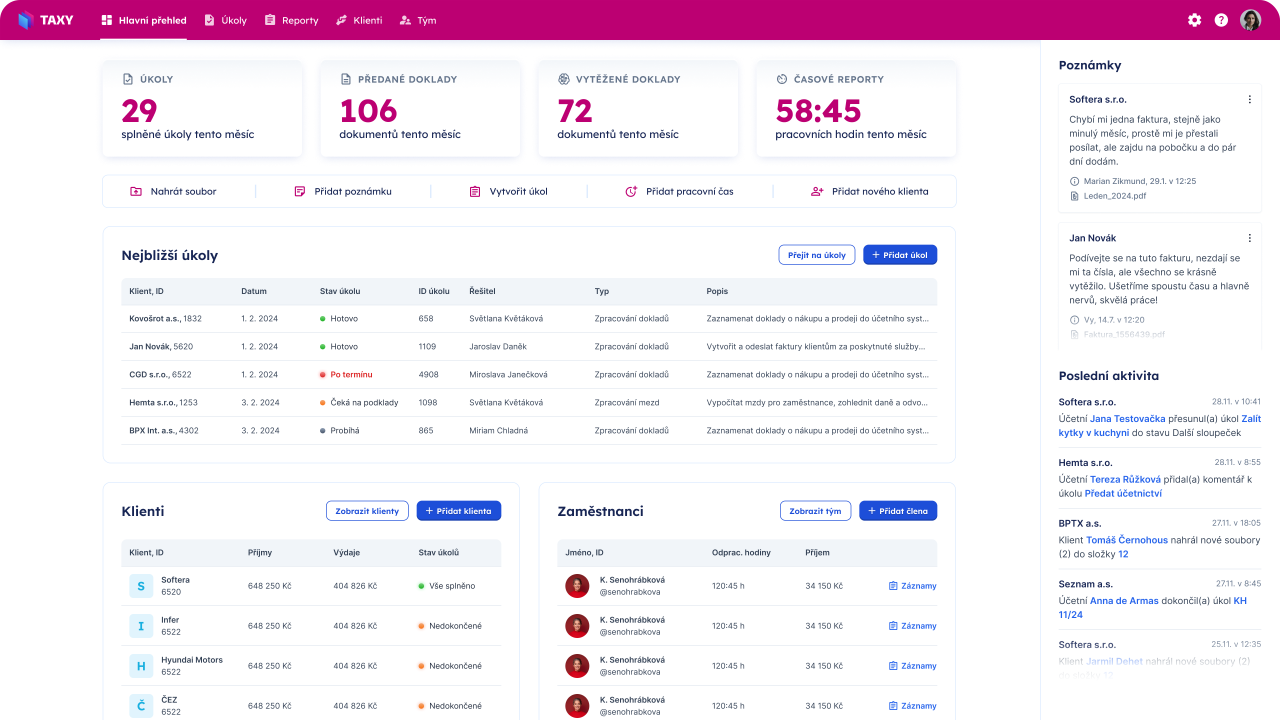
Client portal
Clear reports and analytics in real time
Get an instant overview of your accounting, cash flow and key indicators. TAXY metrics give clients and accountants a clear picture of a company's financial health.
Real-time overviews and reports
Interactive charts and analytics
Automatic report generation
How do metrics in TAXY work?
step 1
Data updates automaticallystep 2
The system generates clear reportsstep 3
Clients see their metrics in real timestep 4
Accountants have an overview of all clientsstep 5
Managers track work efficiencyIntelligent analytics
Data that speaks for itself
Metrics and reports in TAXY turn raw data into useful information. Clients see a clear picture of their business, accountants have an overview of all clients and managers can track work efficiency. All reports are generated automatically and always up to date.
Automatic report generation
Interactive charts and visualisations
Comparison with previous periods

Start with intelligent metrics
Clear reports and analytics help you understand your business better and make informed decisions.
How working with data changes with modern analytics tools.
Traditional reports vs. TAXY metrics
Manual reports
Time-consuming report creation
Stale data from last month
Static tables with no interactivity
Limited access to data
No automatic analytics
TAXY metrics
Automatic report generation
Real-time data and updates
Interactive charts and filters
Access from anywhere, anytime
AI analytics and recommendations
The benefits of intelligent metrics
Modern analytics tools bring clarity and certainty for everyone involved.
Real-time overviews
All data is updated in real time. Clients see the current state of their business, accountants have an overview of all clients.
Interactive analytics
Charts and reports are fully interactive. Users can filter data, change time periods and explore different aspects of their business.
Automatic reports
The system automatically generates regular reports — monthly, quarterly, yearly. No manual work, everything ready to use.